
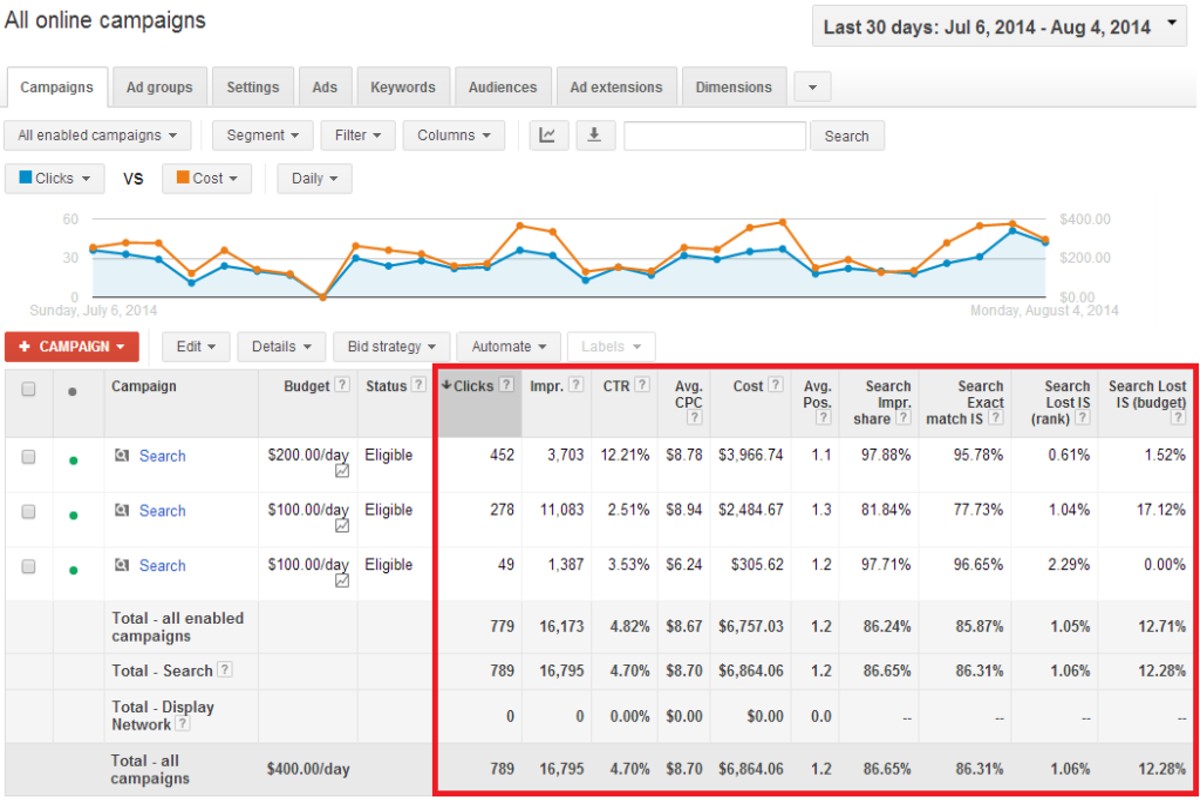
To analyze Google Ads performance, review key metrics such as CTR, conversion rate, and ROI. Utilize Google Ads reporting tools to gain insights into campaign effectiveness and make data-driven decisions.
Understanding how to analyze Google Ads performance is crucial for marketers and businesses investing in online advertising. Misinterpreting data can lead to wasted budgets and missed opportunities, highlighting the need for accurate analysis to optimize campaigns effectively.
This guide covers essential metrics for evaluation, including click-through rates, conversion tracking, and return on investment, along with practical steps to use Google Ads tools for comprehensive performance analysis.
What metrics should I use to analyze Google Ads performance?
Key metrics to analyze Google Ads performance include Click-Through Rate (CTR), Conversion Rate, and Cost per Conversion. These metrics provide insight into how effectively ads engage users and drive desired actions. By monitoring these indicators, advertisers can make informed decisions to optimize campaign performance.
Click-Through Rate (CTR) measures the percentage of users who click on an ad after seeing it. A higher CTR indicates that the ad is relevant and appealing to the target audience. Conversely, a low CTR may suggest that the ad copy or targeting needs refinement. Conversion Rate tracks the percentage of clicks that result in a desired action, such as a purchase or sign-up. This metric reveals the effectiveness of the landing page and overall user experience. A strong conversion rate indicates successful alignment between ad messaging and the landing page content.
- Cost per Conversion calculates the average cost incurred to achieve a conversion. This metric is crucial for assessing the financial efficiency of advertising efforts.
- Quality Score evaluates the relevance of keywords, ads, and landing pages, influencing both ad rank and cost-per-click (CPC).
- Impressions provide insight into how often ads are displayed, helping to gauge the overall reach of campaigns.
Each of these metrics offers unique insights into different aspects of campaign performance. Regularly reviewing these metrics allows advertisers to identify trends, uncover areas for improvement, and adjust strategies accordingly. A well-rounded approach to performance analysis combines these quantitative insights with qualitative feedback, such as customer reviews and market research.
Expert Tip: Utilize A/B testing to experiment with variations in ad copy and landing page design. This method can yield actionable data on which elements drive higher CTR and conversion rates, enabling continuous optimization of Google Ads performance.
How can I improve my Google Ads performance analysis?
Improving Google Ads performance analysis involves implementing advanced tracking methods, conducting A/B testing, and utilizing Google Analytics for deeper insights. These strategies provide a comprehensive view of campaign effectiveness and user behavior, enabling data-driven decisions. By focusing on these key areas, advertisers can enhance their understanding of what works and what doesn’t.
- Implement Advanced Tracking: Use conversion tracking and UTM parameters to gain insights into user interactions. This will help identify which ads and keywords drive the most conversions.
- Conduct A/B Testing: Regularly test different ad copies, landing pages, and bidding strategies. A/B testing allows marketers to determine which variations yield better results, ultimately optimizing ad performance.
- Utilize Google Analytics: Integrate Google Ads with Google Analytics to track user behavior post-click. Analyze metrics such as bounce rate, session duration, and goal completions to understand the effectiveness of your ads in driving valuable traffic.
- Monitor Key Performance Indicators (KPIs): Keep track of metrics like Click-Through Rate (CTR), Cost Per Click (CPC), and Return on Ad Spend (ROAS). These KPIs provide insights into campaign efficiency and areas for improvement.
- Adjust Targeting Options: Review and refine targeting settings based on performance data. Focus on demographics, location, and device preferences to reach the most relevant audience.
Expert-level insights can elevate analysis. Consider implementing machine learning tools available in Google Ads to automate bidding strategies based on performance data. This approach can optimize ad spend by adjusting bids in real-time, ensuring maximum visibility for high-performing ads.
What is the average cost of Google Ads per click?
The average cost per click (CPC) for Google Ads typically ranges from $1 to $2 for search ads. However, costs can vary significantly based on various factors, including industry competition and targeting options.
Several elements influence the cost of Google Ads. First, the competitive landscape within a specific industry plays a crucial role. For example, industries like legal services or insurance often face higher CPCs due to intense competition. Additionally, the quality of the ads and landing pages affects costs. Higher quality scores can lead to lower CPCs, as Google rewards relevant and well-structured ads.
- Keyword Competition: Popular keywords that many advertisers target will generally have higher costs.
- Quality Score: This metric, determined by ad relevance, expected click-through rate, and landing page experience, can lower CPCs for well-optimized ads.
- Geographic Targeting: Costs can differ by location. Urban areas may have higher CPCs compared to rural regions.
Advertisers should also consider their bidding strategy. Manual bidding allows for precise control, while automated bidding can optimize for specific goals, potentially affecting CPC. Monitoring performance regularly can help identify trends and opportunities for cost reduction.
Expert Tip: Regularly reviewing and adjusting keyword bids based on performance data can help maintain a competitive edge while managing costs effectively. Implementing negative keywords can also reduce wasted ad spend on irrelevant searches.
How long does it take to see results from Google Ads?
Most advertisers begin to see data from their Google Ads campaigns within a few days to a week after launching. However, the time it takes to see tangible results, such as conversions or increased traffic, can vary significantly based on several factors.
The initial data collection period is typically short, allowing advertisers to assess metrics like impressions and clicks quickly. However, achieving meaningful outcomes, such as sales or leads, may require more time. Factors that influence this timeline include the industry, competition, and the effectiveness of the ad campaign itself. For instance, highly competitive keywords may take longer to yield results as they require more budget and optimization to stand out.
Additionally, the ad quality and relevance play a crucial role. Well-structured campaigns with compelling ad copy and targeted keywords can generate results faster. Conversely, poorly optimized ads may struggle to attract clicks and conversions, delaying the time it takes to see results. Seasonal trends and market fluctuations also affect performance, as certain periods may inherently lead to higher or lower engagement.
Expert Tip: To expedite results, continuously monitor and refine campaigns based on performance metrics. Utilize A/B testing on ad variations to identify the most effective strategies quickly.
What are the best practices for analyzing Google Ads?
To effectively analyze Google Ads performance, regularly review key performance metrics, utilize segmentation, and adjust bids based on data insights. These practices ensure that campaigns remain aligned with business objectives and respond to market dynamics.
One of the most critical best practices is to regularly review performance metrics. Focus on metrics such as Click-Through Rate (CTR), Conversion Rate, and Cost Per Acquisition (CPA). Monitoring these figures helps identify trends and areas needing improvement. Set a schedule for reviews—daily, weekly, or monthly—depending on campaign size and goals.
- Utilize segmentation to gain deeper insights into campaign performance. Break down data by demographics, device, location, and time. This allows for tailored strategies that address specific audience behaviors and preferences.
- Adjust bids based on data insights to optimize ad performance. Use automated bidding strategies, such as Target CPA or Target ROAS, to align bids with conversion goals. Regularly reassess these strategies based on performance data to ensure optimal spend.
- Conduct A/B testing on ad copy, landing pages, and targeting options. This approach helps identify the most effective elements of your campaigns. Use the insights gained from these tests to refine and enhance overall performance.
- Implement conversion tracking to measure the effectiveness of ads in driving desired actions. Set up tracking for various conversion types, such as purchases, sign-ups, or downloads, to evaluate ROI accurately.
Expert Tip: Incorporate attribution modeling to understand the customer journey better. This helps in identifying which touchpoints contribute most to conversions, allowing for more informed budget allocation across channels.
How do I compare Google Ads performance across campaigns?
To compare Google Ads performance across campaigns, utilize Google Ads’ built-in comparison tools that allow you to evaluate key metrics side by side. This straightforward approach helps identify which campaigns are performing better based on specific objectives like clicks, conversions, and cost-per-acquisition.
Google Ads provides several metrics for comparison, including Click-Through Rate (CTR), Conversion Rate, and Cost Per Click (CPC). Each of these metrics offers insights into different aspects of campaign performance. For instance, while CTR indicates how well ads attract clicks, Conversion Rate shows how effectively those clicks translate into desired actions. CPC helps assess the cost efficiency of each campaign.
To perform the comparison effectively, access the “Campaigns” tab in your Google Ads account. Select the campaigns you wish to analyze, and use the comparison tool to view metrics side by side. This feature allows for a clear visual representation of performance differences, making it easier to pinpoint strengths and weaknesses. Additionally, consider segmenting data by device or location for deeper insights.
Key Metrics for Comparison
- Click-Through Rate (CTR) – Measures the percentage of clicks relative to impressions.
- Conversion Rate – Indicates the percentage of users who completed a desired action after clicking on the ad.
- Cost Per Click (CPC) – Reflects the average amount spent for each click on the ad.
When analyzing, remember to consider the campaign objectives and target audience. Different campaigns may have varying goals, which can affect how metrics should be interpreted. For instance, a campaign focused on brand awareness may have a higher CTR but lower Conversion Rate compared to a sales-focused campaign.
Expert Tip: Regularly review performance comparisons over different time frames to identify trends and seasonality in campaign effectiveness. This practice can inform future strategies and budget allocations.
What tools can help me analyze Google Ads performance?
Several tools can effectively help analyze Google Ads performance, including Google Analytics, SEMrush, and AdEspresso. Each of these tools offers unique features that provide insights into various aspects of ad effectiveness, from click-through rates to conversion tracking.
For instance, using Google Analytics alongside Google Ads allows marketers to track user behavior after they click on an ad. By setting up conversion goals, one can see how many visitors complete desired actions, such as making a purchase or signing up for a newsletter. This data can highlight which campaigns drive the most valuable traffic, enabling targeted adjustments to improve ROI.
SEMrush offers competitive analysis features, allowing users to see how their ads stack up against competitors. By entering a competitor’s domain, marketers can view their ad strategies, budget allocations, and keyword targets. This information can guide the optimization of ad campaigns by identifying gaps or opportunities in the market.
Another useful tool is AdEspresso, particularly for those managing multiple ad campaigns across different platforms. It simplifies A/B testing by allowing users to create variations of ads and analyze their performance side by side. This capability helps in determining which creative elements resonate best with the target audience, leading to more effective ads.
Expert Tip: Regularly cross-reference data from these tools to gain a holistic view of ad performance. For example, combining behavioral insights from Google Analytics with keyword performance data from SEMrush can uncover deeper insights, allowing for more strategic decision-making.
What common mistakes should I avoid when analyzing Google Ads?
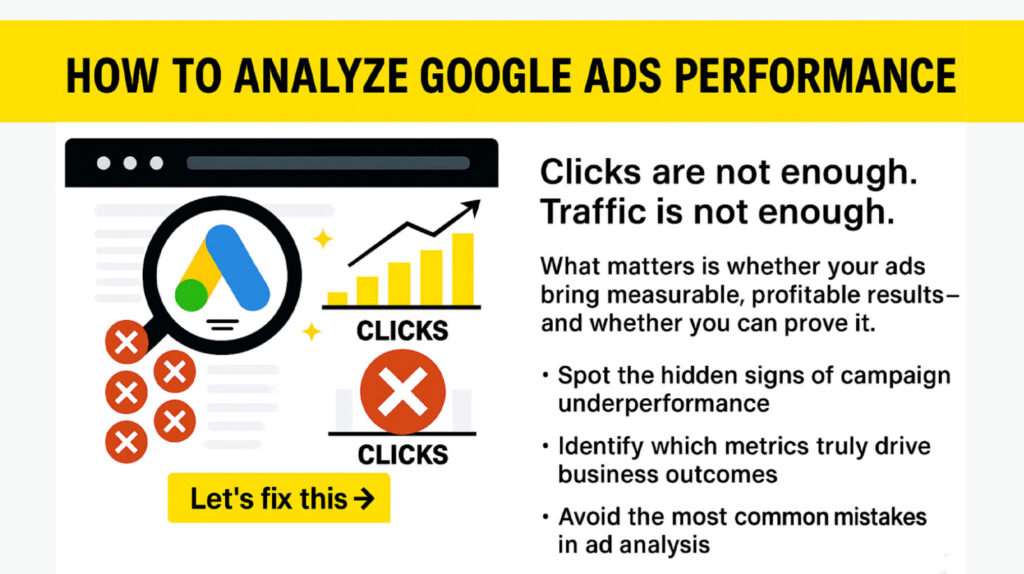
Many advertisers make the mistake of focusing solely on clicks when analyzing Google Ads performance. This narrow perspective can lead to misinformed decisions and missed opportunities for optimization. Instead, a comprehensive analysis should prioritize conversions and overall return on investment (ROI).
First, avoid fixating on click-through rates (CTR) without considering the quality of traffic. A high CTR may seem positive, but if those clicks do not convert into sales or leads, they do not contribute to business success. Focus on metrics like conversion rates and cost per acquisition (CPA) to gauge the effectiveness of your campaigns.
- Neglecting conversion tracking: Ensure that conversion tracking is properly set up and monitored. This allows for accurate measurement of how many clicks lead to desired actions, providing insights into campaign effectiveness.
- Ignoring search terms report: Regularly review the search terms report to identify which queries trigger your ads. This analysis can reveal valuable insights into customer intent and help refine keyword targeting.
- Overlooking ad relevance: Assess the relevance of your ads to the keywords and landing pages. Irrelevant ads may lead to low-quality scores, increasing costs and reducing visibility.
- Failing to test variations: Implement A/B testing for ad copies, landing pages, and bidding strategies. This practice helps identify the most effective elements and improves overall campaign performance.
Expertly analyzing Google Ads performance requires a balanced approach that integrates metrics beyond clicks. Continuous refinement based on data-driven insights will enhance campaign effectiveness and profitability. Remember, a successful Google Ads campaign is measured not just by traffic but by its ability to drive meaningful results.
Understanding Key Performance Metrics for Google Ads
This section delves into key performance metrics that are vital for analyzing Google Ads effectiveness. A thorough understanding of these metrics enables advertisers to optimize campaigns and drive better results.

Click-Through Rate (CTR)
Click-Through Rate (CTR) measures the ratio of users who click on an ad to the number of times the ad is shown (impressions). It is expressed as a percentage and calculated using the formula:
- CTR (%) = (Clicks / Impressions) × 100
A higher CTR indicates that the ad is relevant and compelling to the audience. An average CTR varies by industry, but a benchmark of 2% is often considered effective. Evaluating CTR alongside industry standards helps in assessing ad performance accurately.
Conversion Rate
The conversion rate reflects the percentage of users who complete a desired action after clicking on the ad, such as making a purchase or signing up for a newsletter. It is calculated with the following formula:
- Conversion Rate (%) = (Conversions / Clicks) × 100
Understanding conversion rates allows advertisers to evaluate the effectiveness of their landing pages and the overall user experience. A conversion rate of 5% is typically seen as a strong performance metric, but this can vary significantly across different sectors.
Quality Score
Quality Score is a metric used by Google to measure the relevance and quality of ads, keywords, and landing pages. It ranges from 1 to 10, with higher scores indicating better quality. Factors influencing Quality Score include:
- CTR: Higher CTRs contribute positively.
- Ad relevance: The alignment of ad text with keywords.
- Landing page experience: A user-friendly and relevant landing page enhances scores.
Improving Quality Score can lead to lower costs per click and better ad placements, making it a critical metric for optimizing Google Ads campaigns.
Return on Investment (ROI) and Customer Acquisition Cost (CAC)
ROI measures the profitability of advertising efforts and is calculated as:
- ROI (%) = [(Revenue – Cost) / Cost] × 100
Customer Acquisition Cost (CAC) reflects the total cost associated with acquiring a new customer, calculated by:
- CAC = Total Cost of Campaign / Number of New Customers Acquired
Monitoring ROI and CAC is essential for determining the effectiveness of advertising spend. A positive ROI indicates successful campaigns, while a low CAC suggests efficient customer acquisition strategies.
Using Metrics to Inform Future Advertising Strategies
Metrics such as CTR, conversion rate, Quality Score, ROI, and CAC provide insights that inform future advertising strategies. Regular analysis of these metrics can identify trends, strengths, and weaknesses, allowing for data-driven adjustments to campaigns.
Common misconceptions include the belief that high CTR guarantees conversions or that a low Quality Score cannot be improved. In reality, each metric interacts with others, and a holistic approach is necessary for optimization.
To effectively analyze Google Ads performance, follow these steps:
- Regularly monitor CTR, conversion rates, Quality Score, ROI, and CAC.
- Compare metrics against industry benchmarks to gauge performance.
- Adjust ad copy, targeting, and landing pages based on insights gained from metrics.
- Test different strategies and evaluate their impact on performance metrics.
Adopting a systematic approach to metric analysis will facilitate continuous improvement and success in Google Ads campaigns.
Advanced Techniques for Google Ads Performance Analysis
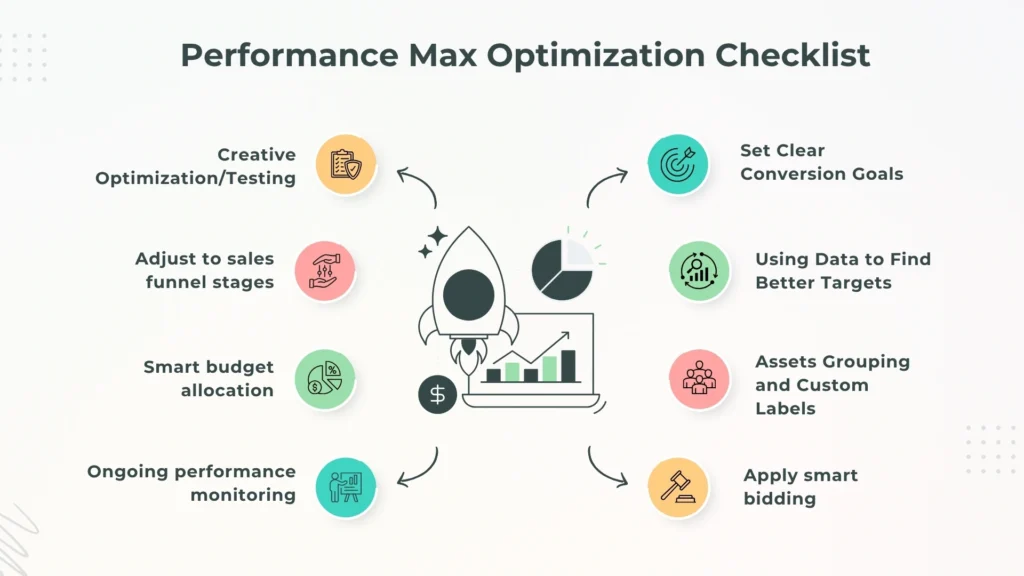
This section delves into sophisticated methodologies and tools essential for an in-depth analysis of Google Ads performance. Mastering these advanced techniques enables marketers to extract actionable insights and drive campaign success.
Implementing Conversion Tracking and Setting Up Goals
Effective conversion tracking is foundational for measuring the success of Google Ads campaigns. By setting up specific goals—such as purchases, form submissions, or newsletter sign-ups—marketers can determine which ads drive the most valuable actions. Implement conversion tracking through the following steps:
- Access your Google Ads account and navigate to the ‘Tools & Settings’ menu.
- Select ‘Conversions’ under the ‘Measurement’ section.
- Click the ‘+’ button to create a new conversion action and define the desired goal.
Ensure that the tracking code is correctly implemented on the corresponding webpage to capture accurate data.
Utilizing Google Analytics for Cross-Platform Insights
Integrating Google Ads with Google Analytics provides a comprehensive view of user behavior across platforms. This integration allows marketers to analyze how users interact with their website after clicking on an ad. Key metrics to explore include:
- Bounce Rate: Understand how many visitors leave the site without taking action.
- Session Duration: Gauge how long users stay engaged after clicking through an ad.
- Goal Completions: Track the total number of conversions attributed to Google Ads traffic.
Utilize the ‘Multi-Channel Funnels’ report in Google Analytics to assess the role of Google Ads in the conversion path.
A/B Testing Strategies to Refine Ad Performance
A/B testing, or split testing, allows marketers to compare two versions of an ad to determine which performs better. To effectively implement A/B testing:
- Define a clear objective for the test, such as increasing click-through rates (CTR).
- Create two variations of an ad, changing one element (e.g., headline, image, or call-to-action).
- Run the ads simultaneously to ensure similar exposure conditions.
- Analyze the performance data after a sufficient testing period and determine the winning variant.
Regular A/B testing can lead to incremental improvements in ad performance over time.
Leveraging Audience Segmentation for Targeted Analysis
Audience segmentation allows for a more granular analysis of ad performance by categorizing users based on specific criteria, such as demographics, interests, and behaviors. Implement the following strategies for effective segmentation:
- Create custom audiences based on prior interactions with your website.
- Utilize remarketing lists to target users who have shown interest but have not converted.
- Analyze performance metrics for each segment to identify high-value audiences.
This targeted approach enables more efficient ad spend and improved ROI.
Advanced Google Ads analysis can reveal insights that drive campaign optimization. To apply these techniques effectively, ensure conversion tracking is set up, leverage Google Analytics for cross-platform insights, conduct regular A/B tests, and utilize audience segmentation. By integrating these strategies, marketers can achieve a more nuanced understanding of their ad performance and enhance their overall digital marketing effectiveness.
Common Mistakes in Google Ads Performance Analysis
Accurate performance assessment in Google Ads requires attention to detail and an understanding of various metrics. This section outlines common pitfalls that can lead to misleading conclusions and ineffective campaign adjustments.
Overlooking Mobile vs. Desktop Performance Differences
Failing to distinguish between mobile and desktop performance can skew overall campaign evaluations. Different user behaviors on these platforms affect key metrics such as click-through rates (CTR) and conversion rates. For example, mobile users may engage differently due to screen size and browsing habits, leading to divergent performance outcomes. Analyzing data collectively without dissecting device-specific performance can mask issues that are only present in one segment.
Neglecting Long-Term Trends in Favor of Short-Term Data
Focusing exclusively on short-term data can lead to reactive rather than proactive campaign management. Short-term fluctuations, such as spikes in CTR or conversions, might not indicate a sustainable trend. Analyzing data over a longer period allows for a more comprehensive view of performance and aids in identifying consistent patterns. For instance, a campaign may have a temporary boost due to seasonal factors or promotions that do not reflect overall effectiveness.
Failing to Adjust Campaigns Based on Performance Data
Many advertisers make the mistake of maintaining underperforming campaigns without making necessary adjustments. Continuous performance monitoring is essential for optimizing Google Ads. Regularly reviewing metrics such as cost per acquisition (CPA), return on ad spend (ROAS), and quality score can inform strategic changes. Neglecting to act on this data can result in wasted budget and missed opportunities for improvement.
Relying Solely on Click Metrics Without Considering Conversions
Clicks are often seen as the primary indicator of success, but they do not tell the full story. High click volumes without corresponding conversions indicate a disconnect between ad messaging and audience intent. Advertisers should prioritize conversion metrics, such as conversion rate and total conversions, to assess campaign effectiveness. This shift in focus helps to identify whether ads are reaching the right audience and driving meaningful actions.
Nuance / Expert Layer
One common misconception is that all metrics can be evaluated in isolation. In reality, metrics are interdependent. For example, a high CTR may be misleading if the conversion rate is low, suggesting that while the ad is attracting clicks, it fails to engage users effectively. Additionally, different campaigns may have varying objectives—brand awareness vs. lead generation—requiring tailored metrics for analysis. Understanding the context and interrelation of these metrics is essential for a nuanced performance evaluation.
Practical Application
To avoid these pitfalls, implement the following steps:
- Segment performance data by device to identify discrepancies.
- Analyze trends over a minimum of three months to establish a baseline.
- Regularly update campaigns based on performance insights, adjusting bids and targeting as necessary.
- Focus on conversion metrics alongside click data to gauge true campaign success.
By addressing these common mistakes, advertisers can enhance their strategies and achieve better results in their Google Ads campaigns.
Real-World Case Studies: Successful Google Ads Performance Analysis
This section highlights practical examples of Google Ads performance analysis, showcasing successful campaigns and the insights gained from both victories and failures. Analyzing real-world cases provides actionable lessons for businesses looking to enhance their advertising strategies.
Successful Campaign Case Study: XYZ E-commerce
XYZ E-commerce launched a targeted Google Ads campaign aimed at increasing sales of a new product line. The campaign utilized a combination of dynamic search ads and remarketing strategies. Key metrics analyzed included Click-Through Rate (CTR), Conversion Rate, and Return on Ad Spend (ROAS). Over the first quarter, the campaign achieved a CTR of 5.2%, a conversion rate of 12%, and a ROAS of 400%.
- CTR: Higher than the industry average of 2.5%, indicating effective ad copy and targeting.
- Conversion Rate: Demonstrated strong user engagement, prompting further investment in similar ad formats.
- ROAS: The company earned $4 for every $1 spent, validating the campaign’s financial viability.
Lessons from Failed Campaigns: ABC Software
ABC Software experienced a significant drop in performance for a Google Ads campaign intended to promote a subscription service. The initial analysis revealed a low CTR of 1.2% and a conversion rate of only 3%. Key factors contributing to this failure included poor keyword selection and lack of ad relevance.
In response, ABC Software made several adjustments:
- Refined Keyword Strategy: Focused on long-tail keywords that better matched user intent.
- Enhanced Ad Copy: Implemented A/B testing to determine which messaging resonated with the target audience.
- Target Audience Segmentation: Leveraged demographic data to tailor ads more effectively.
Data Utilization for Optimization
Effective data analysis has become integral for businesses optimizing their Google Ads campaigns. Companies are increasingly leveraging analytics tools to gain insights into user behavior and ad performance. By analyzing metrics such as Quality Score, Impression Share, and Cost per Acquisition (CPA), businesses can identify areas for improvement.
For instance, a tech startup used audience insights to adjust bidding strategies based on user engagement levels, resulting in a 25% decrease in CPA over three months.
Advanced Analysis Techniques in Real Life
Advanced analysis techniques, such as machine learning algorithms and predictive analytics, are being adopted by leading advertisers. These methods allow businesses to forecast trends and optimize ad placements dynamically. For example, a retail company implemented machine learning to analyze purchasing patterns and adjust ad spend in real-time based on predicted customer behavior.
Many advertising professionals overlook the importance of integrating advanced tools with traditional metrics. Combining qualitative insights with quantitative data enables a more comprehensive view of campaign performance.
Practical Application
To leverage these insights effectively, businesses should:
- Regularly review campaign metrics, focusing on CTR, conversion rates, and ROAS.
- Implement A/B testing to refine ad copy and targeting.
- Utilize advanced analytics tools to gain deeper insights into user behavior and optimize campaign strategies accordingly.
Frequently Asked Questions
What metrics should I use to analyze Google Ads performance?
Key metrics for analyzing Google Ads performance include Click-Through Rate (CTR), Conversion Rate, Cost Per Click (CPC), and Return on Ad Spend (ROAS). These metrics provide insights into ad effectiveness and overall campaign success.
How can I improve my Google Ads performance analysis?
To enhance Google Ads performance analysis, regularly review campaign data, set clear goals, and utilize A/B testing for ads. Implementing these strategies allows for data-driven decisions and continuous optimization.
What is the average cost of Google Ads per click?
The average cost per click (CPC) for Google Ads varies widely depending on the industry, typically ranging from $1 to $2 on the Search Network. Competitive industries may see costs exceeding $50 per click.
How long does it take to see results from Google Ads?
Results from Google Ads can typically be seen within a few days to a week, depending on the campaign settings and budget. However, optimal performance may take several weeks of data collection and adjustments.
What are the best practices for analyzing Google Ads?
Best practices for analyzing Google Ads include tracking performance metrics consistently, segmenting data for deeper insights, and adjusting bids based on campaign performance. Regularly reviewing and refining campaigns leads to improved results.
How do I compare Google Ads performance across campaigns?
To compare Google Ads performance across campaigns, use standardized metrics such as CTR, conversion rates, and ROAS. Analyzing these metrics side-by-side helps identify which campaigns are most effective.
What tools can help me analyze Google Ads performance?
Tools such as Google Ads Reports, Google Analytics, and third-party platforms like SEMrush or WordStream can assist in analyzing Google Ads performance. These tools provide comprehensive data and insights for optimization.
What common mistakes should I avoid when analyzing Google Ads?
Common mistakes to avoid include not tracking the right metrics, ignoring data trends, and failing to adjust campaigns based on performance. Neglecting these aspects can lead to ineffective advertising strategies.
Final Thoughts on how to analyze google ads performance
Effective analysis of Google Ads performance hinges on a deep understanding of key metrics and the application of advanced techniques. By avoiding common pitfalls and focusing on data-driven insights, advertisers can significantly enhance their campaign outcomes and ROI.
To immediately improve your Google Ads performance analysis, implement a structured A/B testing framework for your ads, allowing for systematic evaluation of what resonates best with your audience.
Mastering Google Ads performance analysis is essential, as it directly impacts your ability to allocate resources efficiently and achieve marketing success in a competitive landscape.
Leave a Reply